In 2025, organisations across industries are doubling down on DevOps because software delivery speed, reliability and team performance increasingly define competitive success. According to recent research, by 2025 over 78 % of companies have adopted DevOps practices, and many report up to 46-times more frequent code deployments and 96-times faster recovery from failures compared with less mature teams. Yet adoption alone is not enough — what separates high-performing teams is the systematic measurement and improvement of their delivery processes by tracking the right DevOps KPIs.
At the same time, DevOps is evolving beyond CI/CD pipelines. Teams are now embedding frontend delivery workflows (for example, JavaScript teams) into their DevOps models, integrating security (DevSecOps) and enabling full-stack visibility. For example, in our article 7 ways DevOps enhances frontend JavaScript we described how frontend teams measure release cadence, code quality and operational metrics in parallel with backend workflows. This expansive view means that DevOps metrics must reflect not just ops efficiency, but business value, team health and customer impact.
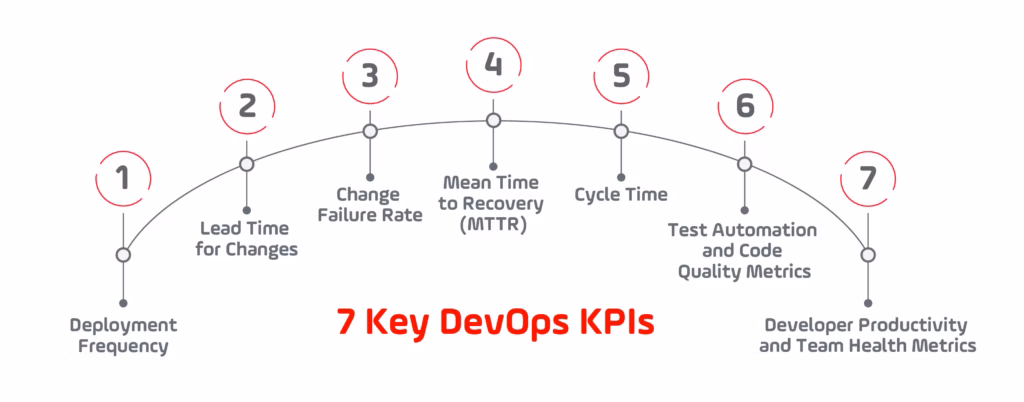
This guide covers seven essential DevOps KPIs that high-performance teams track and improve in 2025. You’ll learn what each metric means, why it matters, how to measure it, and how it links back to business outcomes and team performance. Whether your team is just establishing a DevOps culture or looking to level up your measurement maturity (referencing concepts from our full DevOps 2025 guide), this post will provide a practical framework to chart your progress.
By the end of this article you will be able to answer:
- Which DevOps metrics provide meaningful insight into delivery performance and team efficiency?
- How to quantify and interpret each of the seven KPIs in your environment?
- What trade-offs and pitfalls to watch out for when applying DevOps metrics?
As you read on, you will also find references to how metrics tie into quality, security and full-stack delivery — all essential if you want your DevOps KPI model to reflect real value rather than vanity numbers.
1. Deployment Frequency
Why Deployment Frequency Matters in 2025
Among all DevOps KPIs, deployment frequency remains the clearest signal of how effectively a team delivers value. It measures how often code is released to production or made available to users within a defined period, revealing both agility and operational maturity.
In 2025, this DevOps KPI has become more than a measure of throughput — it represents an organization’s capacity to innovate safely and continuously. The Google Cloud State of DevOps Report 2024 shows that elite teams deploy nearly a thousand times more frequently than low performers, proving how closely deployment cadence correlates with customer satisfaction and competitive advantage. Frequent, incremental releases allow faster feedback loops, smaller risk windows, and a consistent flow of improvements to end users. For a concise visual overview of how deployment frequency (one of the core DevOps KPIs) fits into the DORA framework, check the webinar with Nathen Harvey here.
How to Measure This DevOps KPI
Deployment frequency can be captured automatically through CI/CD systems such as GitHub Actions, GitLab CI/CD, or Jenkins. These tools record every successful deployment and feed data directly into performance dashboards. Observability platforms like Datadog, Splunk, or New Relic then transform this information into actionable insights, displaying deployment trends alongside other key DevOps metrics such as lead time for changes, change failure rate, and mean time to recovery (MTTR).
Modern engineering teams increasingly connect this DevOps KPI to business outcomes. Instead of focusing purely on speed, they analyze how release frequency affects feature adoption, user retention, and overall product stability — creating a clear link between delivery cadence and customer value.
Real-World Examples
Recent industry benchmarks highlight how improving deployment frequency continues to separate elite DevOps performers from the rest. According to MiddlewareHQ’s 2025 analysis, Amazon’s engineering teams deploy new code approximately every 11.6 seconds, demonstrating how far automation and continuous delivery practices have evolved. This level of deployment cadence reflects mature process integration, robust testing automation, and a deep cultural commitment to continuous improvement — all essential traits for high-performing teams measuring this DevOps KPI.
Insights from the Octopus Deploy DevOps Performance Clusters Report also show that deployment frequency remains the single strongest differentiator between high- and low-performing organizations. Elite teams in the study deployed multiple times per day across distributed architectures, while lower-performing teams released only once every few weeks. The data confirmed that as deployment frequency increases alongside strong testing and monitoring practices, change failure rates drop significantly and recovery times improve.
Together, these findings confirm that enhancing this DevOps KPI is not just about speed — it’s about achieving measurable, repeatable delivery performance. Organizations that automate, measure, and continuously refine their deployment process gain the agility to adapt quickly to market shifts while maintaining the stability their customers depend on.
Balancing Speed and Stability
While higher deployment frequency indicates agility, it can backfire if pursued without adequate safeguards. Tracking this DevOps KPI in isolation may push teams to value quantity over quality. Mature DevOps organizations apply continuous-confidence practices — automated tests, canary releases, and feature-flag strategies — ensuring that each release maintains quality standards. The objective is not merely to deploy faster, but to deploy reliably, every time.
Frontend and Full-Stack Implications
Deployment frequency affects more than backend services. Modern frontend and full-stack teams rely on the same DevOps KPI to accelerate interface updates, synchronize micro-frontend releases, and tighten feedback loops between design and production. Aligning deployment cadence across disciplines keeps delivery synchronized and customer experience consistent.
Key Takeaway
Deployment frequency defines the rhythm of your delivery pipeline — the pace at which innovation reaches users. When tracked alongside complementary DevOps metrics like change failure rate, MTTR, and lead time for changes, this DevOps KPI becomes a cornerstone of measurable, repeatable improvement in 2025.
2. Lead Time for Changes
Why Lead Time Matters in 2025
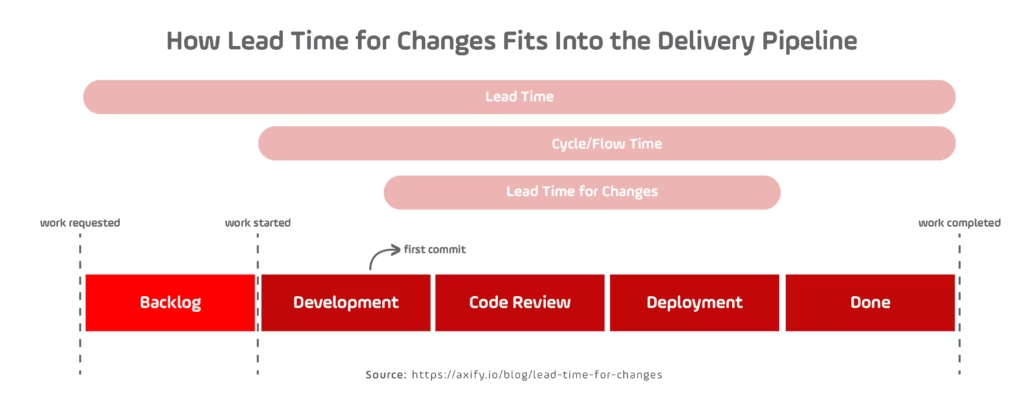
Lead time for changes is one of the most critical DevOps KPIs because it measures how quickly a code commit moves from development to production. In essence, it quantifies the efficiency of your software delivery pipeline — how fast ideas become features. Shorter lead time reflects healthy collaboration, automated testing, and smooth CI/CD execution, while longer lead time often signals workflow bottlenecks, manual approvals, or technical debt.
According to the Google Cloud State of DevOps Report 2024, elite performers deliver code changes from commit to production in less than one day, whereas low performers may take a month or more. This enormous gap demonstrates why this DevOps KPI is so tightly correlated with innovation capacity and customer satisfaction.
How to Measure This DevOps KPI
Tracking lead time for changes requires visibility across the entire CI/CD process. Modern tools such as GitHub Actions, GitLab, and CircleCI can measure the duration between the initial commit and a successful deployment. Many teams automate this process using DORA metric dashboards, connecting repository data with pipeline logs to visualize this DevOps KPI in real time.
A healthy lead time doesn’t just mean “faster development.” It signals that tests, code reviews, and release approvals are automated and predictable. Advanced teams combine this DevOps KPI with deployment frequency and change failure rate to identify whether faster delivery is actually improving quality. For example, if deployment frequency increases but lead time also rises, it may indicate excessive work in progress or branching complexity.
Real-World Examples
Recent research on engineering performance shows how strongly lead time for changes shapes real delivery outcomes. Axify’s article “Lead Time for Changes Explained (DORA Metric)” published in 2024, describes how this DevOps KPI is computed and references DORA benchmarks where elite teams keep lead time for changes under one hour, high performers stay between one hour and one week, and low performers take more than six months. These benchmarks make it clear that long lead times are usually a symptom of process friction, manual gates, or unclear ownership across the delivery pipeline.
A 2025 post from Axify on DevOps metrics provides concrete examples of how improving flow metrics can transform performance. Two teams at Development Bank of Canada reduced pull request cycle time by 70 percent and realised a 10x return on investment within three months after instrumenting their pipelines and acting on the data. In the same report, Newforma is cited as delivering 22 times more often after optimising its delivery workflow. While these stories focus on cycle time and deployment cadence, they are tightly connected to lead time for changes: reducing review delays, shrinking batch sizes, and automating checks directly shortens the time from first commit to production.
Together, these examples show that lead time for changes is not an abstract DevOps KPI. When teams measure it and address the underlying bottlenecks, they unlock faster feedback, more predictable releases, and a stronger foundation for continuous improvement.
Reducing Lead Time Without Sacrificing Quality
A common misconception is that improving this DevOps KPI requires simply speeding up deployments. In reality, sustainable improvement comes from simplifying workflows and eliminating manual gates. Practices such as continuous code review, test automation, and ephemeral test environments shorten delivery cycles while maintaining reliability.
Additionally, integrating performance and security testing earlier in the pipeline — as emphasized in recent DevSecOps best practices — allows issues to surface before release, reducing rework and post-deployment incidents. The most advanced teams treat every phase of delivery as measurable and improvable, ensuring that shorter lead time translates into higher-quality output.
Frontend and Cross-Functional Implications
Lead time for changes applies across all domains, not just backend systems. Frontend and mobile teams benefit from monitoring this DevOps KPI to understand how long it takes for UI or UX improvements to reach production. Coordinating this measurement across full-stack teams helps identify systemic blockers — whether in testing infrastructure, release governance, or cross-team communication — that slow overall delivery.
Key Takeaway
Lead time for changes reveals the heartbeat of your development process. It quantifies how efficiently your organization transforms code into customer-facing value. By pairing this DevOps KPI with deployment frequency, change failure rate, and MTTR, teams gain a complete view of delivery performance — enabling them to optimize both speed and stability in 2025.
3. Change Failure Rate
Why Change Failure Rate Matters in 2025
Change failure rate is a critical DevOps KPI because it measures how often production releases lead to failures, rollbacks, or hot-fixes. While deployment frequency captures speed and lead time measures latency, change failure rate reveals the stability of your delivery process. In 2025 the ability to release quickly and reliably is what separates high-performance teams from the rest.
How to Measure This DevOps KPI
To measure change failure rate you divide the number of failed deployments over a time period by the total number of deployments in that same period. Most CI/CD platforms (such as GitHub Actions, GitLab CI/CD, Jenkins) can capture deployment data, while monitoring systems (like Datadog, PagerDuty, Splunk) detect incidents or rollbacks. Tracking this DevOps KPI in isolation is useful, but best practice involves tying it to other metrics such as deployment frequency and mean time to recovery (MTTR) to understand whether your delivery process is both fast and safe.
Real-World Examples
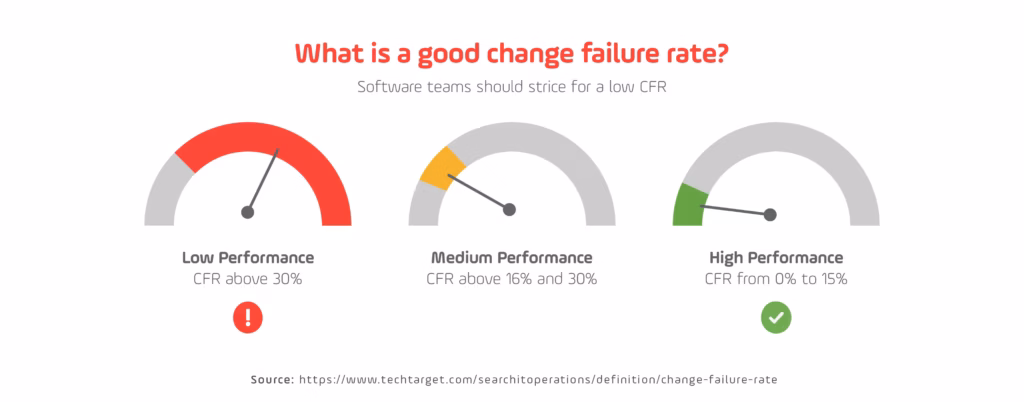
In the DORA 2024 report, the data indicates that elite teams maintain change failure rates of approximately 5 percent, whereas teams at the lower end may see failure rates around 40 percent. Additional commentary from RedMonk shows that for the first time, the medium performance cluster reported a lower change failure rate than the high performance cluster — indicating that improved stability is possible even at mid-level throughput. These examples illustrate how this DevOps KPI is a meaningful differentiator: teams that deploy often and keep failure rates low achieve both velocity and resilience.
Balancing Innovation and Stability
Achieving a low change failure rate requires more than fewer bugs — it requires smaller deployments, automated testing, strong observability and a culture that treats failures as learning opportunities. Simply increasing deployment frequency without improving this DevOps KPI may lead to increased customer impact, technical debt and reduced trust. Successful teams focus on reducing the size of changes, automating rollback mechanisms, instituting feature flags and running blameless post-mortems to transform failures into improvements.
The Cultural Impact of Measuring Failures
Tracking change failure rate touches not just technology but also team culture. Teams that openly monitor and discuss this DevOps KPI foster psychological safety and continuous improvement. Benchmarking failure rates and reviewing incidents regularly supports a shift from “avoid mistakes” to “learn and adapt rapidly,” enabling sustained delivery performance in 2025.
Key Takeaway
Change failure rate is the stability metric that complements speed-oriented DevOps KPIs. When measured alongside deployment frequency, lead time for changes and MTTR, it gives a complete view of software delivery health. By systematically reducing change failure rate, teams increase both confidence and agility — a vital capability in today’s fast-moving software environment.
4. Mean Time to Recovery (MTTR)
Why MTTR Matters in 2025
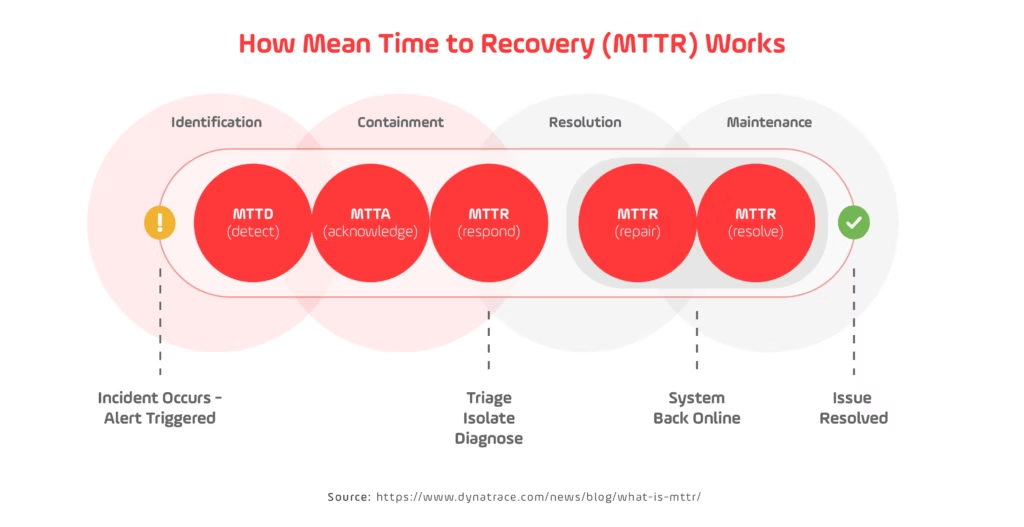
Mean Time to Recovery, or MTTR, is one of the most practical DevOps KPIs for understanding how resilient your system and team truly are. It measures the average time it takes to restore service after a production incident — whether caused by a failed deployment, infrastructure fault, or third-party issue. In 2025, as software delivery environments grow more complex, MTTR has become a central metric for operational excellence and customer trust.
High-performing teams focus on reducing MTTR because downtime directly impacts user experience, revenue, and brand perception. Short recovery times indicate mature incident management, strong observability, and a culture that prioritizes learning over blame. In contrast, long recovery windows often reveal bottlenecks in monitoring, alerting, or communication — key areas where this DevOps KPI drives continuous improvement.
How to Measure This DevOps KPI
MTTR is calculated by dividing the total downtime by the number of incidents within a specific period. It is typically measured in minutes or hours. The data comes from incident management and monitoring tools such as PagerDuty, Grafana, Datadog, or Jira Service Management, all of which timestamp alerts and resolution events automatically.
Teams that take a data-driven approach pair this DevOps KPI with other metrics like change failure rate and deployment frequency to assess how quickly they recover after a release-related issue. If deployment frequency is high but MTTR also increases, it suggests that automation, testing, or rollback processes need refinement.
Real-World Examples
Research from the 2024 DORA Report shows that elite teams restore service within one hour on average, compared with low performers that may take several days. This illustrates how MTTR acts as a differentiator between organizations that can recover rapidly and those that struggle with system fragility.
In 2025, a notable example comes from Netflix’s engineering reliability initiatives, which continue to demonstrate how automated observability and chaos engineering reduce MTTR significantly. Netflix teams simulate failures in production to test recovery processes proactively, ensuring that response times stay consistent even under load. This approach has influenced DevOps cultures globally, reinforcing MTTR as a leading DevOps KPI for resilience.
Improving MTTR Through Automation and Culture
Reducing MTTR is less about individual heroics and more about system design. Automated rollback mechanisms, self-healing infrastructure, and alert correlation platforms allow teams to resolve incidents faster with minimal manual intervention. Leading organizations also standardize their post-incident review processes, identifying root causes quickly and sharing lessons learned across teams.
Equally important is cultivating a culture that views incidents as learning opportunities rather than failures. Teams with blameless retrospectives often recover faster because they focus on solving problems instead of assigning responsibility. This cultural aspect makes MTTR both a technical and organizational DevOps KPI.
The Security and DevSecOps Angle
Security incidents increasingly factor into recovery metrics. Integrating DevSecOps practices — such as automated vulnerability scanning, real-time alerting, and zero-trust access controls — enables teams to detect and recover from security-related disruptions more efficiently. This alignment of operational and security disciplines represents the next evolution of MTTR optimization in 2025.
Key Takeaway
Mean Time to Recovery is the resilience benchmark within the DevOps KPI framework. It measures not just how quickly systems recover, but how effectively teams detect, respond, and learn from failure. When tracked alongside change failure rate and deployment frequency, MTTR provides a comprehensive picture of delivery stability, helping organizations sustain both speed and reliability in an unpredictable digital landscape.
5. Cycle Time
Why Cycle Time Matters in 2025
Cycle time is one of the most practical DevOps KPIs for evaluating development efficiency at the team level. It measures the total time a work item takes to move from “in progress” to “done,” capturing how quickly features, fixes, or enhancements flow through the development process. While lead time for changes focuses on delivery speed from commit to production, cycle time extends that view to include all stages of active work — planning, coding, review, and testing.
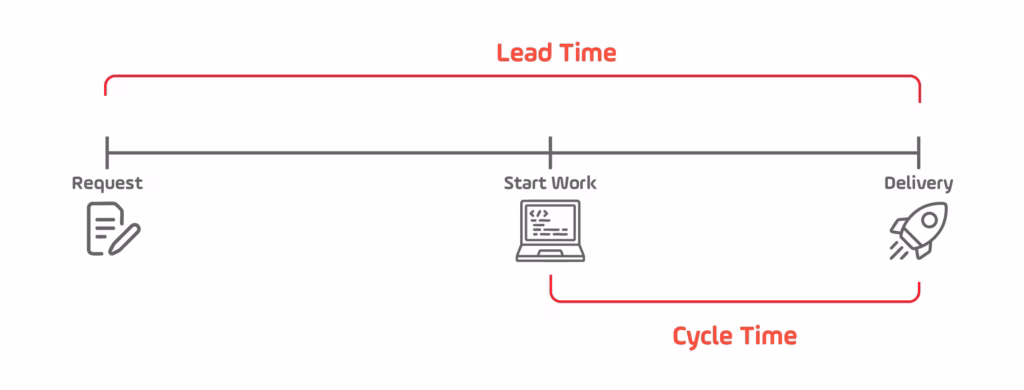
In 2025, reducing cycle time is critical to maintaining competitiveness in fast-moving industries. Shorter cycles mean faster feedback, fewer context switches, and higher adaptability to shifting priorities. This DevOps KPI reflects both process health and team alignment — when it’s long, the issue usually lies not in tooling but in communication, review delays, or over-loaded workflows.
How to Measure This DevOps KPI
Cycle time can be tracked automatically using tools such as Jira Software, Linear, or Azure DevOps, which record timestamps from issue creation to closure. Many teams break down this DevOps KPI into sub-metrics:
- Coding time: from the first commit to pull request creation
- Review time: from pull request creation to merge
- Deployment time: from merge to production release
Modern teams analyze these stages separately to identify bottlenecks. For example, if review time dominates total cycle time, introducing pair programming or automating static checks can accelerate approvals without sacrificing quality.
Real-World Examples
Recent engineering benchmark studies highlight the growing focus on optimizing cycle time as a core DevOps KPI. LinearB’s 2025 Engineering Benchmarks: Insights from 6.1 Million Pull Requests analyzed thousands of software delivery pipelines across industries and found that elite teams achieved up to 45 percent faster cycle times than the global median by combining automation, smaller pull requests, and continuous feedback loops. These improvements didn’t just speed up delivery — they correlated with lower change failure rates and higher developer satisfaction scores, demonstrating the direct link between faster flow and system stability.
GitHub’s internal developer-productivity research in 2024 reported similar gains. By introducing automated workflow triggers and shortening branch lifespan, GitHub reduced its median cycle time by nearly half, enabling smaller, safer, and more frequent deployments. This case shows how reducing cycle time naturally enhances other DevOps KPIs, including deployment frequency and lead time for changes.
Together, these examples illustrate that shorter cycle times lead to higher team morale, more predictable delivery, and faster validation of product ideas. For modern teams, this DevOps KPI isn’t just about engineering velocity — it’s about creating a sustainable flow that balances speed, quality, and business impact.
Strategies for Reducing Cycle Time
Improving cycle time is less about speed and more about flow. Teams that excel at this DevOps KPI:
- Limit work in progress (WIP) to prevent context switching
- Automate repetitive review and testing tasks
- Use real-time collaboration tools to reduce communication delays
- Continuously visualize bottlenecks through cumulative-flow diagrams or Kanban analytics
Applying these practices allows teams to achieve predictable delivery rhythms while keeping quality consistent.
The Relationship Between Cycle Time and Business Value
From a business perspective, cycle time measures responsiveness to change — how quickly a company can pivot based on new requirements, feedback, or incidents. A lower cycle time means faster validation of ideas and earlier return on investment. As organizations mature in DevOps, this DevOps KPI becomes a direct reflection of their ability to innovate sustainably.
Key Takeaway
Cycle time is the operational pulse of software delivery. It quantifies how efficiently teams turn intent into action, connecting process improvement directly to business outcomes. When tracked alongside deployment frequency, lead time for changes, and change failure rate, this DevOps KPI provides the insight teams need to balance speed, stability, and innovation in 2025.
6. Test Automation and Code Quality Metrics
Why Quality-Focused KPIs Matter in 2025
Speed without quality leads to instability, and that’s why test automation and code quality metrics have become central DevOps KPIs in 2025. As organizations accelerate release cycles, ensuring that every deployment maintains reliability and performance is essential. Measuring these indicators allows teams to maintain fast delivery while controlling risk — a balance that defines high-performing DevOps cultures.
According to Stack Overflow’s Developer Survey 2025, over 72 percent of teams now rely on automated testing frameworks and static-analysis tools to track test coverage, defect density, and code complexity. These practices directly affect the broader set of DevOps KPIs, since stronger automation reduces change failure rate and mean time to recovery while improving developer satisfaction.
How to Measure This DevOps KPI
Test automation and code quality can be evaluated through several quantitative indicators:
- Automated test coverage: the percentage of code executed by automated tests during CI/CD runs.
- Defect density: the number of confirmed defects per thousand lines of code.
- Code churn: how often code is rewritten within a short period, signaling instability.
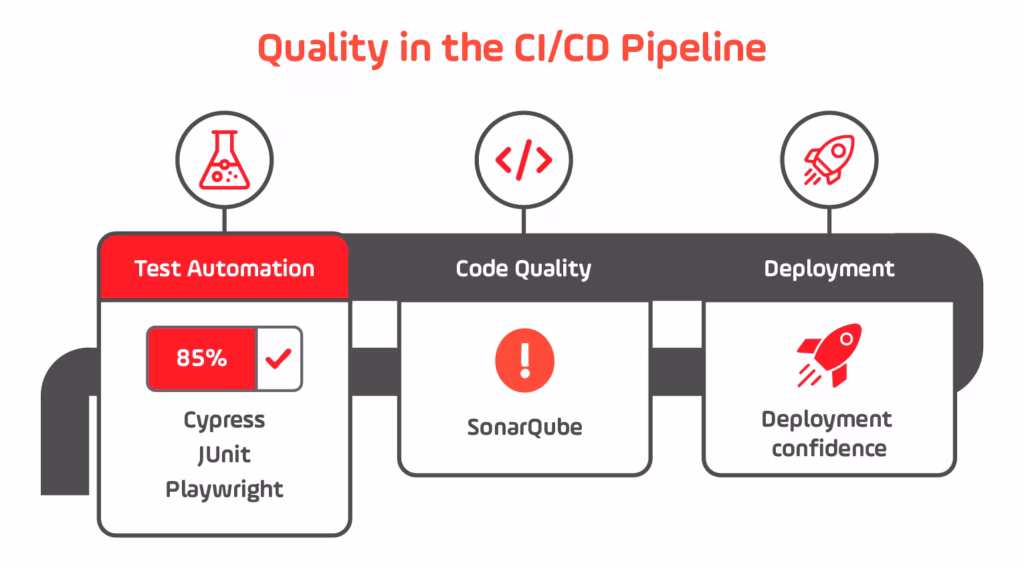
- Static-analysis score: derived from tools such as SonarQube, ESLint, or CodeQL.
Most teams integrate these metrics directly into their CI/CD pipelines. Continuous testing tools like Playwright, Cypress, and JUnit record pass/fail results automatically, while observability platforms surface trends over time. This integration makes test automation an actionable DevOps KPI, linked directly to deployment outcomes and release confidence.
Real-World Examples
Recent industry reports show how strongly test automation and code quality influence wider DevOps KPIs. TestRail’s Fourth Edition Software Testing & Quality Report, published in 2025, draws on responses from more than two thousand QA professionals worldwide. The report notes that teams with strong automation and CI/CD integration are far more likely to report faster release cycles and reduced defect leakage. In one highlighted data point, most teams with robust automation tied to CI/CD saw both shorter time-to-release and fewer bugs escaping into production, confirming that this DevOps KPI directly supports speed and stability.
The same report emphasizes that high-satisfaction QA teams share a common set of priorities: they treat test automation as a top focus, invest in increasing coverage, and involve QA earlier in the development lifecycle. These practices align closely with modern DevOps metrics: by surfacing defects earlier and enforcing consistent quality gates in CI/CD, they lower change failure rate and help keep mean time to recovery under control. In other words, stronger test automation and code quality metrics improve multiple DevOps KPIs at once rather than acting as an isolated quality signal.
On the engineering side, LinearB’s 2025 Software Engineering Benchmarks work, based on over 6 million pull requests from 3,000 organisations, links faster, smaller pull requests and disciplined workflows to better DORA metrics and shorter cycle times. The associated analysis “Metrics that Move the Needle – Unlocking Flow with Software Engineering Intelligence” shows that elite teams cut end-to-end cycle time to under 26 hours by using automation, improving PR hygiene, and tightening feedback loops. These behaviours rely heavily on test automation and code quality checks built into the pipeline, reinforcing quality as a core DevOps KPI rather than an afterthought.
Together, these findings make it clear that test automation and code quality metrics are not just operational details. They are strategic DevOps KPIs that influence throughput, stability, and developer experience, enabling teams to ship faster without compromising reliability.
From Automation to Continuous Quality
Mature DevOps teams view test automation not as a separate activity but as an embedded part of delivery. Continuous testing runs parallel to development, providing instant feedback on code health and security. Code-quality metrics add another dimension by highlighting maintainability issues before they impact production.
The move toward AI-assisted testing and predictive analytics in 2025 is further transforming this space. Intelligent test selection and failure prediction allow teams to focus their effort where it matters most, improving efficiency without compromising coverage.
The Broader Value of Quality Metrics
Quality metrics influence more than just engineering outcomes. They impact business metrics such as customer satisfaction, operational cost, and compliance readiness. By framing test automation as a DevOps KPI, teams tie engineering excellence directly to business resilience — ensuring that growth in speed is matched by growth in trust.
Key Takeaway
Test automation and code quality metrics strengthen the foundation of every delivery pipeline. As core DevOps KPIs, they quantify the health of both code and process, linking quality assurance directly to deployment success. In 2025, the organizations that measure, automate, and continuously improve quality will sustain innovation without sacrificing reliability.
7. Developer Productivity and Team Health Metrics
Why Team Health Is a Core DevOps KPI
In 2025, measuring developer productivity isn’t just about output — it’s about measuring the health, flow, and sustainability of engineering teams. Developer well-being and collaboration quality have emerged as essential DevOps KPIs because they directly affect velocity, reliability, and talent retention. Teams that maintain a healthy delivery environment consistently outperform those that focus solely on quantitative outputs.
How to Measure This DevOps KPI
Team health and productivity are evaluated through a blend of technical, flow and human-centric metrics. Common indicators include:
- Flow efficiency: proportion of active work time versus total cycle time
- Work in progress (WIP): number of simultaneous tasks per engineer or team
- Developer satisfaction surveys: measuring clarity, support, and perceived productivity
- Collaboration signals: code review turnaround time, review quality, communication latency
Team health metrics become actionable DevOps KPIs when they are integrated into delivery dashboards alongside technical metrics (deployment frequency, lead time, change failure rate) and tied to business outcomes like team turnover and feature delivery success.
Real-World Examples
According to the State of Developer Experience Report 2024 by Atlassian, over 69% of developers said they lose more than eight hours per week due to inefficiencies, and only 23% of development teams were satisfied with the developer experience provided by their organisation. This gap between experience and expectation highlights why developer experience must be treated as a measurable DevOps KPI.
Another source, the Measuring Developer Experience: Benchmarks & Theory of Improvement article published in December 2024, outlines how teams improved developer productivity by analysing metrics such as context-switching rate and ‘time to first meaningful commit’. The article emphasises that focusing on developer experience and reducing cognitive load drives improvements across other DevOps KPIs like lead time and change failure rate.
Together, these examples show that developer productivity and team health are not “nice to have” but measurable indicators within the DevOps KPI framework—when managed intelligently they strengthen delivery performance, team satisfaction, and long-term innovation ability.
Building a Sustainable Productivity Model
Today’s organisations are shifting away from classic output metrics (lines of code, story points) toward balanced measurement systems that include human factors and flow metrics. Successful teams treat team health as a foundational DevOps KPI, using regular surveys, limiting WIP, encouraging peer review and focusing on feedback loops. This shift ensures engineering performance remains sustainable even as delivery pace increases.
Why This Matters for 2025
With digital products accelerating and competition rising, engineering teams face high velocity and complex architectures. Measuring developer productivity and team health as part of your DevOps KPI framework ensures you don’t sacrifice sustainability for speed. High-performing teams in 2025 will not just be fast — they’ll be healthy, aligned, and resilient.
Key Takeaway
Developer productivity and team health metrics round out the DevOps KPI framework by placing people at the centre of delivery measurement. They transform delivery metrics from purely technical performance into an organisational view of flow, well-being and impact. The teams that treat these metrics as first-class KPIs will deliver faster, recover smarter and innovate longer.
From Metrics to Mastery: Building Sustainable DevOps Performance
In 2025, DevOps success depends less on adopting tools and more on understanding what to measure. The right DevOps KPIs reveal how effectively your organization balances speed, stability, and quality across the entire software delivery lifecycle.
Teams that track deployment frequency, lead time for changes, change failure rate, mean time to recovery, cycle time, test automation and code quality, and developer productivity gain a complete view of performance. Together, these metrics connect day-to-day engineering work to business outcomes — faster delivery, improved reliability, and stronger team well-being.
As Growin’s perspective on DevOps maturity shows, the future of software delivery isn’t about how fast you ship; it’s about how consistently you improve. When organizations use DevOps KPIs to turn insights into action, they transform performance data into continuous learning, creating a culture of sustainable excellence.
The takeaway is simple: the best DevOps teams don’t just measure what’s easy — they measure what matters most, and they use those insights to master performance over time.