The decision to take the nearshoring route is really about choosing a technology partner that will grow with your business. Once you have engaged in your choice of technology partner, what now?
To begin with, use key metrics that will inform you whether your decision is actually bearing success or not. Additionally, you need key performance indicators (KPIs) in order to measure your progress towards your business objectives.
To help you out, we will walk you through the key metrics that you should periodically measure and monitor, in order to guarantee your nearshoring team’s success.
You can use a burndown chart to quickly gauge the efficiency or productivity of your team. To review, the Scrum methodology divides work into timeboxes—called sprints—then commits to deliver certain amounts of tasks at fixed schedules during the Sprint Planning.
From this estimated schedule, your burndown charts should be composed of two parts—the ideal tasks remaining and the actual tasks remaining. This should let you measure how many hours are left to complete the Sprint in a snapshot.

Based on the chart above, you can consider values above the ideal line as deviations stemming from issues blocking or delaying your partner team from finishing on target. As for the values below the ideal line, consider them as overestimated work that you may need to adjust in the next iteration.
Estimating velocity is all about measuring the amount of work the team can commit to either implementing target features or doing sprints based on historical performance. Simply measure the team’s amount of work in the last sprint and present it as (story) points or hours in your chart.
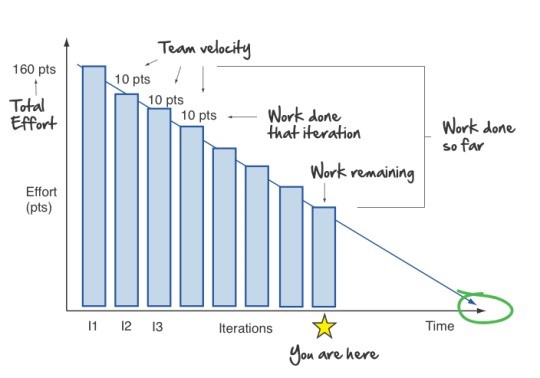
With the nearshoring team velocity metric, you can easily discuss situations, issues, and blockers that affect both the team and individual velocity. It allows you to determine whether there is anything you or the technology partner can do to mitigate the issue or if a re-estimation is justified for the next sprint.
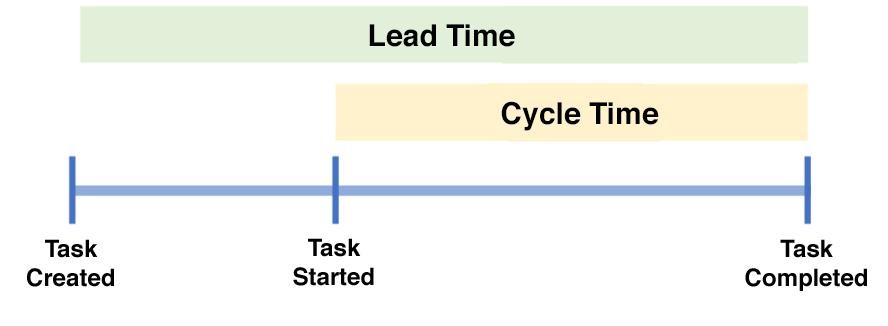
Different tasks within a sprint may have different lead and cycle times, some needing more time than others.
Lead time measures the amount of time it takes for a unit of work—in our case, a software task—to go from “In Queue” status to “Completed” status. It encompasses—and is therefore always longer than—cycle time.
Since business analysis tasks, development, design, and testing have their own lead times, it gives you a good picture of the whole nearshoring team dynamic.
Cycle time measures the average time it takes for a unit of work—again, a software task—to move from “In Progress” status to “Completed” status. The task starts ticking as soon as the task moves from “Ready” status to “In Progress” status, and it stops ticking when the task has moved from “In Progress” status to “Completed” status.
Total Cost to Market stands for the total cost of the software development project from the time your nearshoring team started, completed, shipped, and delivered working values to users.
Total Time to Market refers to the total amount of time it takes for your nearshoring team project to start providing values to users. To determine the Total Time to Market, simply measure the time your nearshoring team started the project to the time the project first shows value.
Your business may determine value as the income generated by the software if it is for market release. Or, it could be your employees’ ability to use the product if it is meant for internal use.
From time to time, you might contract your nearshoring team to enhance the features of a product. This might mean introducing product feature updates or upgrades. It may also entail resolving a buggy feature of the software.
In today’s ultra-competitive market, your business’ time-to-market rate can determine success or failure. Knowing your nearshoring team’s throughput rate will tell you how effective they are in growing your company.
To determine your nearshoring team’s throughput, measure the total number of features or tickets that have been completed within the agreed time. Completion should cover the whole testing to shipping processes. At the end of the day, you should be able to visualize the total work output (TWO) of your nearshoring team.
Once you have determined your IT partner’s metrics, your next step is to measure the resulting numbers against those of your internal teams.
To accomplish this task, create a matrix or chart comparing both teams’ burndown rates, lead/cycle times, the total cost to market and total time to market, and the throughput figures.
Finally, you can create a matrix showing the historical costs or resource expenses against your nearshoring team’s successful deliveries. By doing this, you can address potential issues related to escalating costs acquired by your nearshoring team and mitigate them as early as possible.
Whether undertaken by in-house or nearshoring teams, software development is all about responding quickly to market demands. This dynamic market play requires teams to be agile, capable of adapting quickly to these ever-shifting market demands by scaling up or down given non-linear expenses.
For this reason, leading nearshoring service providers like Growin can be your best partner in software development. Established precisely to meet these dynamically changing market realities, Growin is in a position to scale according to your business needs and budgets.
Unlike in-house teams, Growin provides experience, insight, and expert software developers across multiple software categories and industries. Having a partner that leverages all these qualities, allows you to focus on your core business while Growin handles the works.
We’ve shown you the key metrics to assess the quality of your nearshoring partner. Get in touch with us and see how we can help drive your business to grow.