In 2025, backend resilience isn’t just a nice-to-have — it’s a non-negotiable requirement for enterprises operating in always-on, multi-tenant, API-driven environments. Users expect instant responsiveness. Third-party systems can fail without notice. Infrastructure can vanish in milliseconds. And teams are expected to deliver software that absorbs all of it — gracefully.
As cloud-native adoption deepens, Kubernetes continues to be the operating system of modern backends, orchestrating everything from mission-critical APIs to event-driven AI workloads. But building resilient architectures on Kubernetes remains complex. It demands more than just scaling containers — it requires thoughtful patterns around failure domains, state persistence, traffic control, and observability.
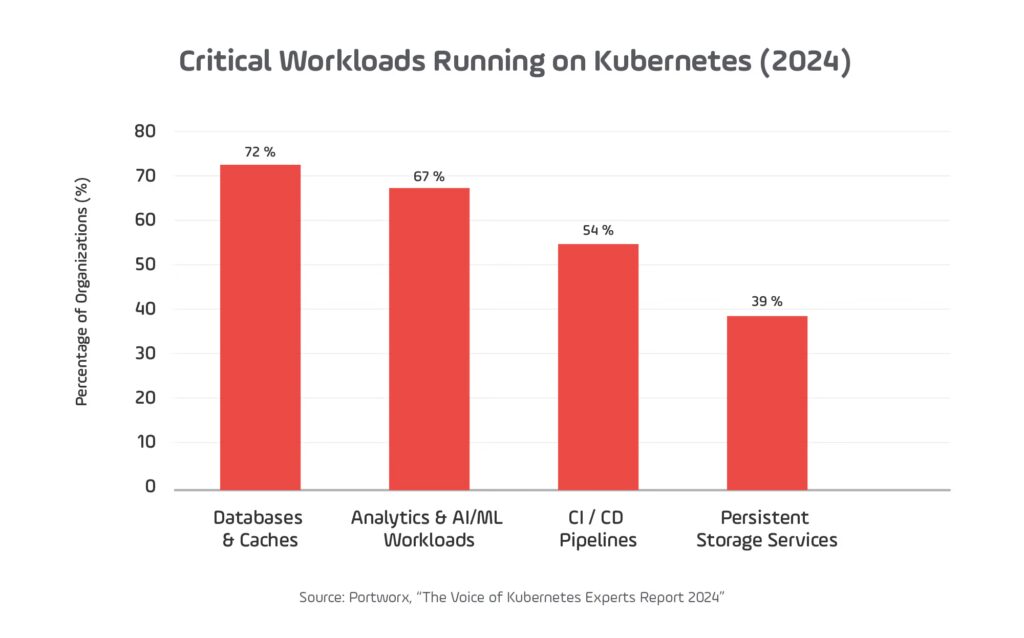
According to the 2024 Voice of Kubernetes Experts report, over 70% of organizations were running databases, pipelines, and analytics on Kubernetes — a sign that resilience is now a core requirement, not a niche concern.”
This guide distills the most impactful strategies for designing and operating fault-resilient backend systems using Kubernetes. It’s built on the reality of 2025 systems: faster release cycles, higher uptime expectations, and deeper dependencies across services, vendors, and zones.
We’ll walk through production-hardened techniques and tooling — validated by real-world examples and aligned with how platform engineering teams operate today. By the end, you’ll have a clear, actionable playbook for improving backend availability, reducing mean time to recovery, and protecting your critical services from both known and emerging failure modes.
Kubernetes Resilience Checklist (2025)
- Use Pod Disruption Budgets (PDBs) to prevent cascading failures during updates
- Apply readiness and liveness probes to detect and recover from app failure modes
- Implement Horizontal Pod Autoscaling (HPA) with real-time metrics (CPU, memory, custom)
- Leverage node pools and affinity rules for fault domain isolation
- Use retry/backoff patterns with circuit breakers via service mesh (e.g., Istio)
- Store state externally using persistent volumes with dynamic provisioning
- Enable multi-zone clusters for higher availability
1. Pod Disruption Budgets (PDBs): Preventing Unintended Downtime
What It Is and Why It Matters in 2025
Pod Disruption Budgets (PDBs) ensure high availability during voluntary disruptions, such as rolling updates, node drains, or cluster auto-scaling. In modern Kubernetes deployments — especially in managed services like EKS, AKS, or GKE — nodes are routinely recycled for patching, and clusters scale elastically. Without PDBs, entire application layers can become unavailable during these operations.
In 2025, multi-tenant and distributed systems rely heavily on microservices deployed across multiple zones. The challenge is no longer just keeping a pod alive — but ensuring that enough replicas of a given service remain healthy and routable at any point in time. PDBs are a foundational piece in this resilience puzzle.
How It Works
Kubernetes allows administrators to define a minimum number of pods (minAvailable) or a maximum allowed disruption (maxUnavailable) for a given workload. During a voluntary disruption, the system will block the operation if it would violate this threshold.
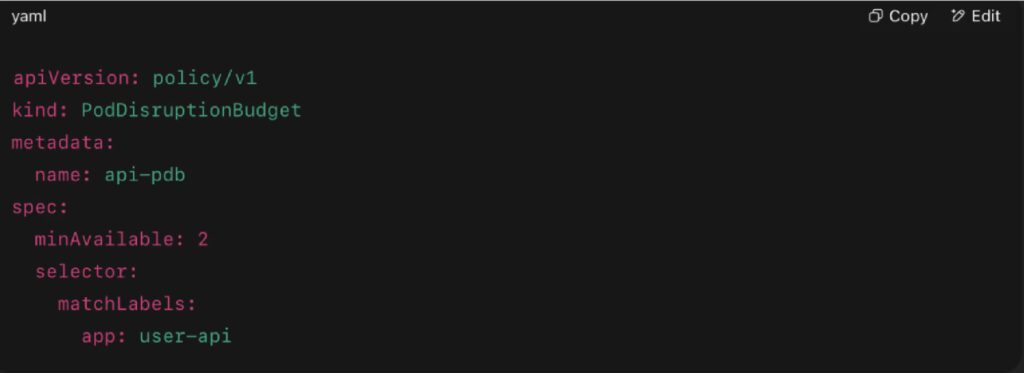
This tells Kubernetes to ensure at least 2 pods remain ready during voluntary disruptions.
Real-World Examples
- Medium Case Study on Using PDB for Zero-Downtime Upgrades
A Medium blog post titled “Zero‑Downtime Node Upgrades with Pod Disruption Budgets and GKE Strategies” documents how PDBs prevent service interruption during GKE node upgrades. It walks through real cluster-based steps and demonstrates how defining PDBs ensures pods are safely evicted one at a time. - Google Cloud GKE Best Practices
Google’s architecture guide “Best practices for running cost-effective Kubernetes applications on GKE” explicitly calls out the recommendation to define PDBs for all applications, noting their importance during cluster autoscaling and node upgrades. - Cloud Native Registry / GKE Disruption Readiness
The GKE documentation “Ensure workloads are disruption-ready” lists PDBs alongside readiness probes as key strategies to ensure pods aren’t killed prematurely during scheduled disruptions like upgrades or maintenance. - Overcast Engineer Guide on PDB Best Practices
An engineering blog outlines best practices and gives use cases for PDBs, such as maintaining a minimum available percentage of pods during rolling upgrades or scaling events.
Tools & Monitoring
1. Kubectl CLI Commands
Purpose: Validate that PDBs are correctly applied and actively protecting workloads.
Useful Commands:
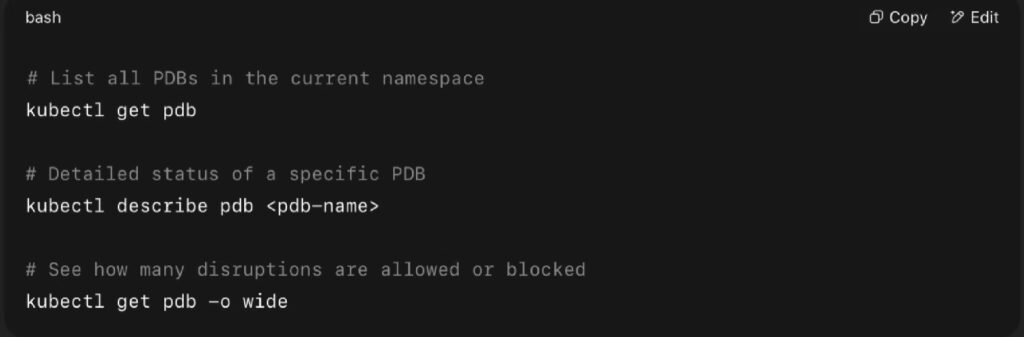
What to watch for:
- Allowed disruptions: 0 → PDB is protecting the service (good)
- Current healthy: X, Desired healthy: Y → Indicates readiness mismatches
- Disrupted pods: [list] → Pods pending graceful eviction
2. Prometheus Metrics (with kube-state-metrics)
Purpose: Enable dashboarding and alerting on disruption risk.
Key Metrics:
- kube_pod_disruption_budget_status_current_healthy
→ Number of currently healthy pods - kube_pod_disruption_budget_status_desired_healthy
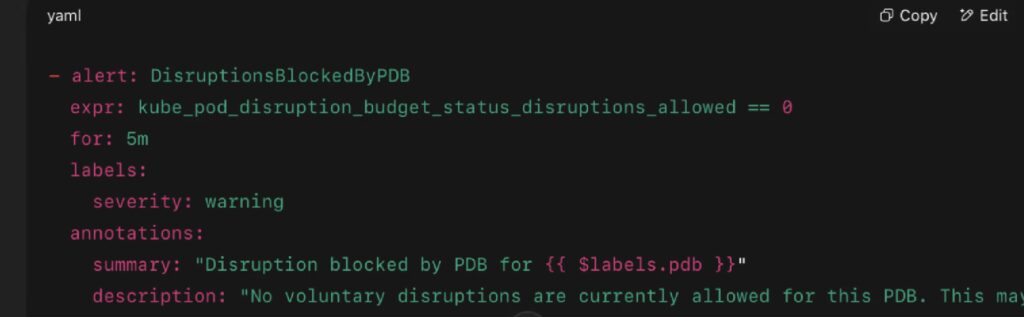
→ Minimum pods that must be healthy according to the PDB - kube_pod_disruption_budget_status_disruptions_allowed
→ How many pods can be voluntarily evicted - eviction_events_total (custom metric via event-exporter)
→ Total voluntary eviction events per service
Sample Prometheus Alert:
3. Grafana Dashboards
Purpose: Visualize pod health and PDB enforcement over time.
Suggested Panels:
- Line chart: kube_pod_disruption_budget_status_current_healthy vs desired_healthy
- Heatmap: eviction_events_total by namespace/deployment
- Table: PDB enforcement status by workload (join with kube_pod_info)
Dashboard Template:
Grafana Labs offers a wide variety of dashboards. Click here to explore and find the one that best fits your needs.
4. Cloud Provider Logs (GKE, EKS, AKS)
Managed Kubernetes platforms often log node drain events, pod evictions, and auto-upgrade operations. These help correlate PDB enforcement with platform behavior.
Google Kubernetes Engine (GKE)
- Event Logs:
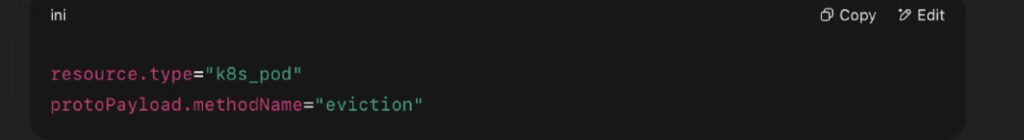
Logs Explorer query to capture eviction events:
- Upgrade History:
The Google Cloud Console section Kubernetes Updates allows you to monitor available GKE version upgrades and apply them safely. Ensure cluster stability while keeping your environment up to date.
Amazon EKS
- CloudTrail Events: Filter by TerminateInstances, EvictPod, or NodeMaintenance
- Integration with Amazon Managed Prometheus (AMP)
Azure AKS
- Diagnostic Settings: Enable Kube-Audit logs to track delete and eviction events
- Azure Monitor Alerts on eviction spikes
5. Kubernetes Event Exporter (optional)
Tool:
Use this to convert Kubernetes events (including eviction attempts blocked by PDBs) into Prometheus metrics or push to Slack, Datadog, etc.
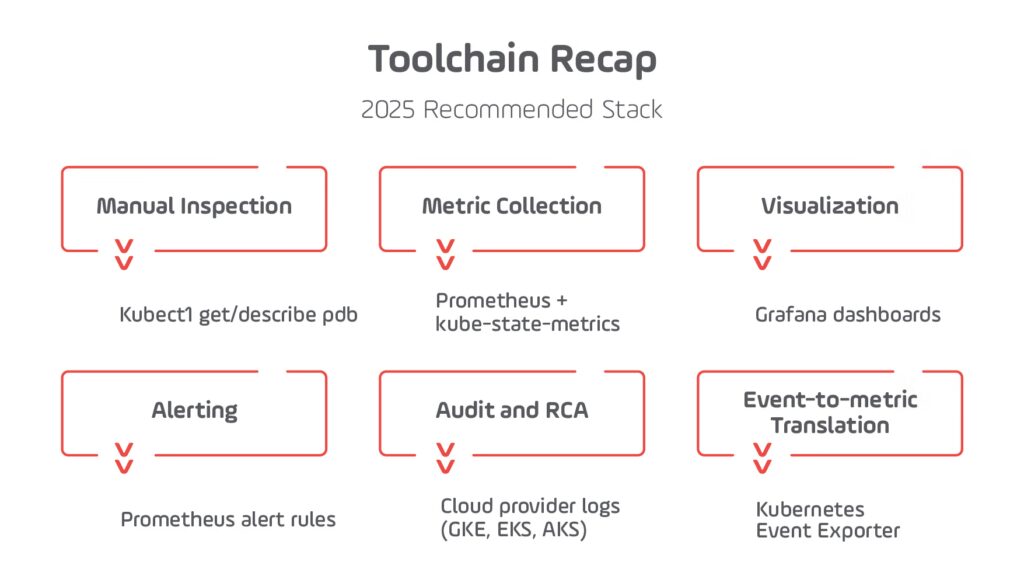
Toolchain Recap (2025 Recommended Stack)
External References
- Explore Kubernetes Docs here.
- See the CNCF Annual Survey (2023) here.
- Click here and check the GKE Best Practices Guide.
2. Readiness and Liveness Probes: Accurate Failure Detection for Modern Backends
What It Is and Why It Matters in 2025
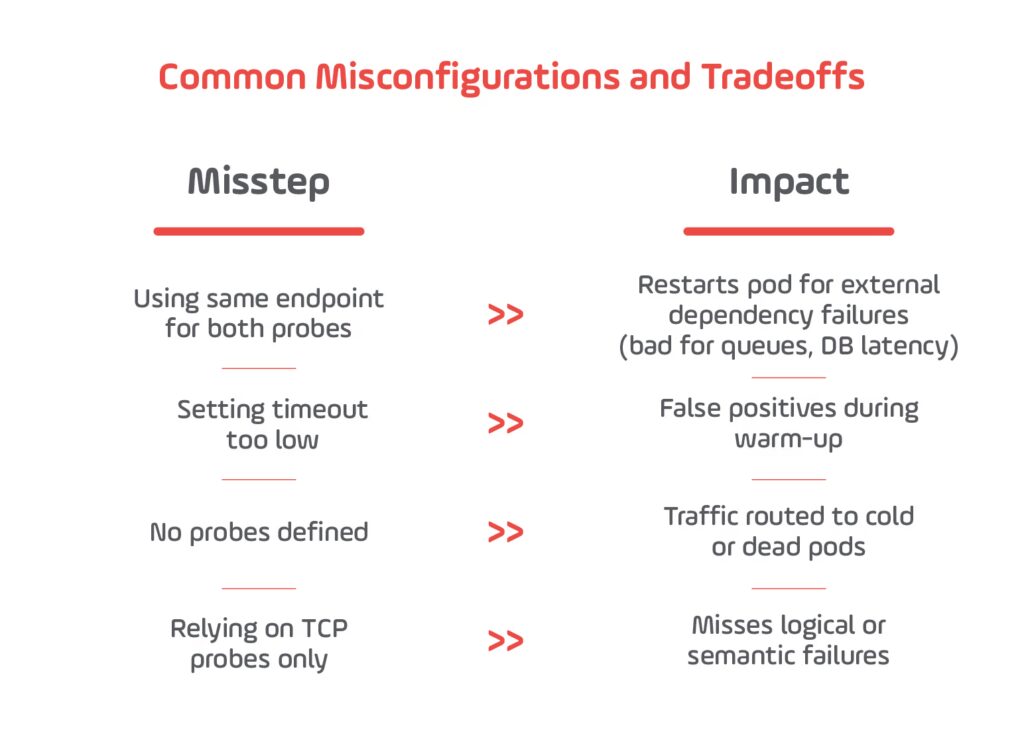
In 2025, applications are more distributed and latency-sensitive than ever. Services often depend on external APIs, managed databases, or internal message queues — all of which can fail or stall independently. Kubernetes’ readiness and liveness probes are critical mechanisms to ensure that traffic only flows to healthy pods and that stuck or degraded containers are automatically restarted.
Yet despite their importance, misconfigured probes remain a top cause of:
- Traffic routing to broken backends
- Cascading failures
- Long incident resolution times
With the increasing adoption of service meshes, AI/ML model servers, and sidecars, health probes must now consider not just binary uptime but partial failures, timeouts, and dependencies.
How It Works
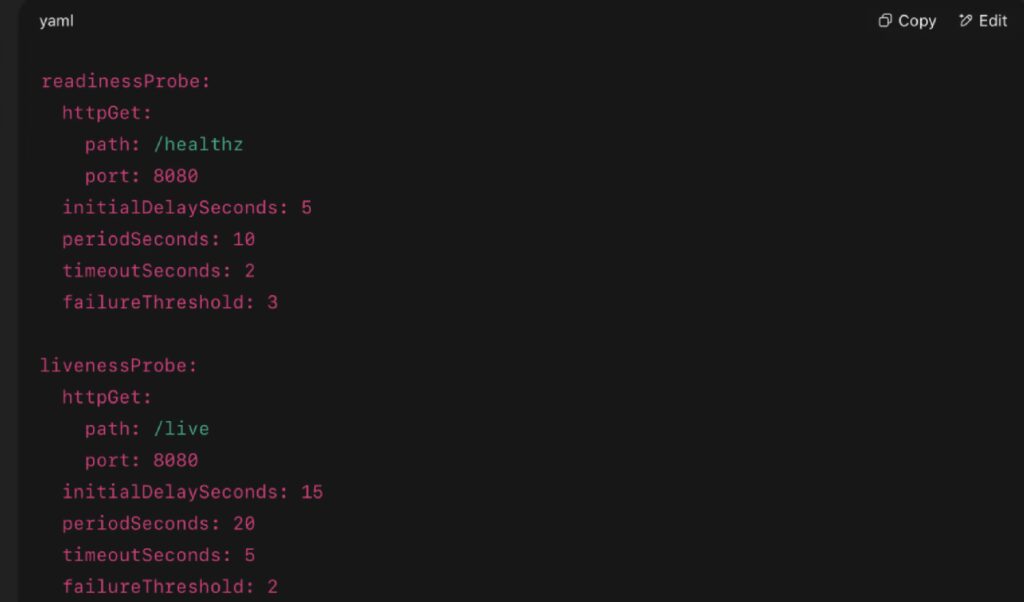
Readiness Probe:
- Indicates when a pod is ready to accept traffic (added to service endpoint list)
- If it fails, traffic is stopped but the pod remains running
Liveness Probe:
- Indicates if a pod is still alive and functioning
- If it fails, the pod is restarted by the kubelet
Configuration Examples
Alternatives:
- exec (runs a shell command inside the container)
- tcpSocket (checks if port is open)
Real-World Case Study: Memory Leak in FastAPI on Kubernetes
Background:
A FastAPI application experienced a memory leak while deployed on Kubernetes. The memory usage kept rising until the pod hit resource limits and froze, but the process remained running — returning HTTP 200 responses with empty payloads. This kind of silent failure is common in inference or ML-based APIs.
Source:
- Medium blog post “Debugging Memory Leaks in a Python app on Kubernetes with memray and Debug Containers”, from Nov 8, 2024, describes diagnosing a memory leak in a Kubernetes-deployed FastAPI service using debug containers and memory profiling.
Validation of Probe Concepts
Kubernetes documentation clearly discusses how liveness probes can detect deadlock or frozen states and restart pods accordingly:
- The Kubernetes “Configure Liveness, Readiness and Startup Probes” documentation says that “kubelet uses liveness probes to know when to restart a container. For example, liveness probes could catch a deadlock, where an application is running, but unable to make progress. Restarting a container in such a state can help to make the application more available despite bugs.”
A specific GitHub ticket also shows real-world evidence of abnormal memory growth that triggered restarts via liveness probes:
- “Over the course of 18 days, the liveness probe container for the controller pod went from using 8 Mi of memory to over 1 Gi.”
2025 Tip:
Use synthetic logic in health endpoints to test actual business functionality (e.g., DB ping, message queue health, or internal cache status).
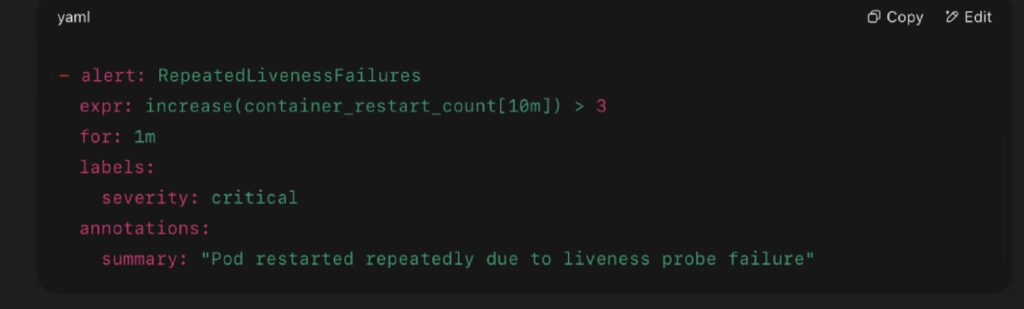
Monitoring & Alerts
Prometheus Metrics:
- kube_pod_container_status_ready
- container_restart_count
- probe_success_total, probe_failure_total (via exporters)
Alert Example:
External Resources
- Check the Kubernetes Probes Overview here.
- Read the Red Hat Blog: Best Practices for Kubernetes here.
- Click here and explore CNCF Annual Report (2023).
3. Horizontal Pod Autoscaling (HPA): Matching Compute to Real-Time Load
What It Is and Why It Matters in 2025
Horizontal Pod Autoscaling (HPA) dynamically adjusts the number of pod replicas in a deployment or statefulset based on real-time resource metrics like CPU, memory, or custom business signals (e.g., queue length, latency).
In 2025, backend systems face extreme traffic volatility due to:
- Mobile-first and international user bases
- AI/ML inference workloads
- Promotional events (e.g., Black Friday, local sales)
- Event-driven workloads and third-party webhook triggers
Static replica counts no longer cut it — they’re either too costly (over-provisioned) or too risky (under-provisioned). HPA is essential for right-sizing services in real time while maintaining SLA and cost efficiency.
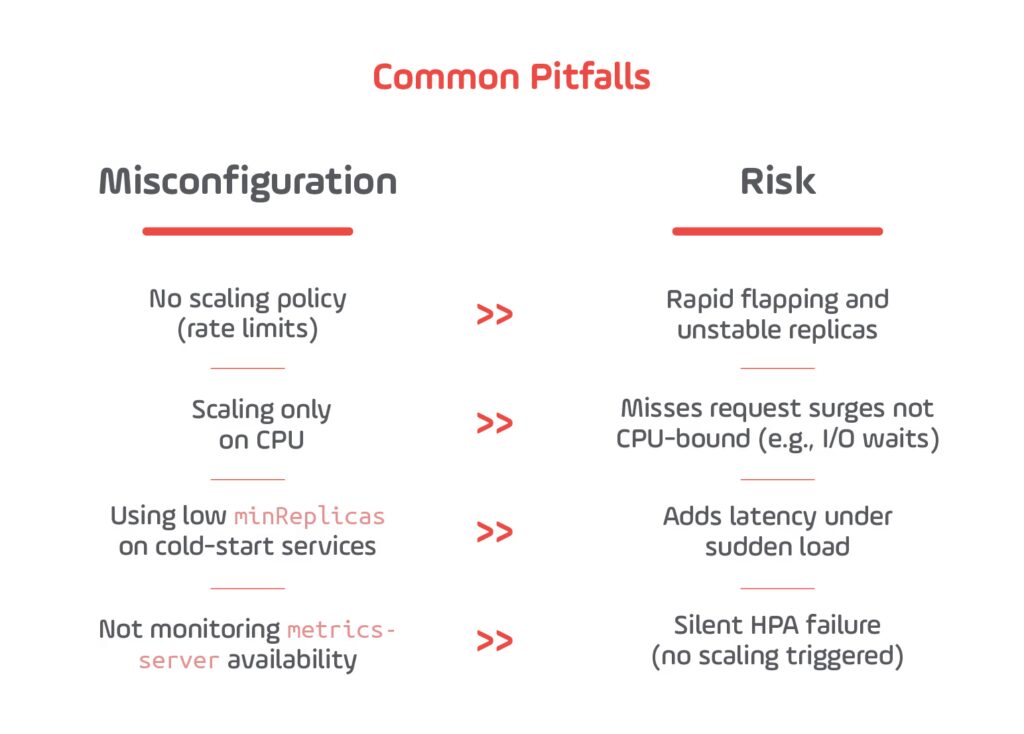
How HPA Works
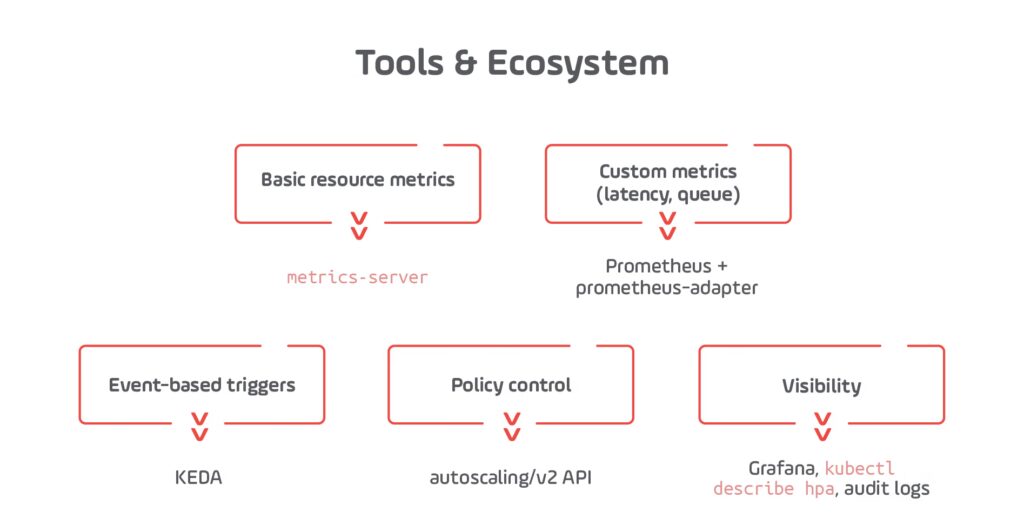
HPA continuously evaluates a target metric using the Kubernetes Metrics API (via metrics-server), Prometheus, or external adapters. When usage exceeds or falls below the target threshold, Kubernetes automatically scales pods within defined bounds.
Configuration Components:
- scaleTargetRef – which deployment to scale
- metrics – what to monitor (CPU, memory, or external)
- minReplicas and maxReplicas – guardrails
- behavior – rate limits and scaling sensitivity (optional, but recommended in 2025)
Example: CPU-Based HPA in YAML
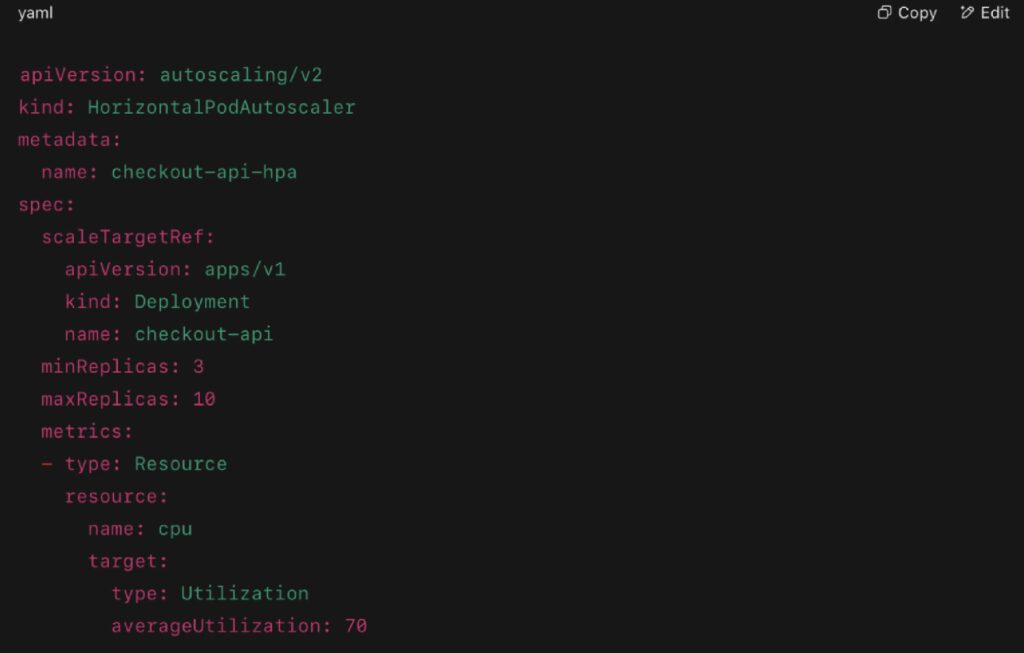
Advanced setups in 2025 often use:
- Multiple metrics (CPU + queue length or latency)
- KEDA (keda.sh) for external event-based triggers
- autoscaling/v2 API for scaling policies
Real-World Example: Scaling for Holiday Traffic Spikes
A LATAM fintech platform deployed a Go-based payments-core API on Kubernetes. It originally ran with 5 static replicas. During a regional holiday shopping event, traffic surged 5× in under 2 minutes. CPU hit 100%, latency spiked, and 5xx errors rolled in.
The problem:
No autoscaler was in place, so pods stayed at 5 until an engineer intervened.
The fix:
Post-incident, the team deployed an HPA with:
- minReplicas: 3, maxReplicas: 20
- averageUtilization: 65% CPU
- Scaling policy: gradual scale-up, limit scale-down frequency
In the next event, the service scaled from 3 to 18 pods in under 2 minutes. No 5xx errors occurred.
This example aligns closely with real-world patterns published by Kubernetes users in production:
Real-World Evidence:
- Alibaba Cloud’s Adaptive HPA (AHPA)
Describes 20% lower cost and high efficiency across ML, social, and logistics workloads using custom metrics with HPA. - Marketing Automation Case Study (Medium, 2024)
Details how HPA + VPA scaled push notification systems effectively. - LinkedIn Post on Holiday Traffic Handling
Outlines HPA in an e-commerce platform during Black Friday, scaling to match regional demand.
Monitoring and Alerting
Key Metrics (Prometheus):
- hpa_replicas_desired
- cpu_usage_seconds_total
- queue_depth or http_requests_in_progress (custom)
- scale_up_events_total (via Prometheus Adapter or KEDA)
2025 Tip:
Use HPA in tandem with KEDA to scale based on Kafka lag, database queries, queue depth, or external API call rate — not just infra-level metrics.
External Resources
- Click here and discover more about Kubernetes Docs on HPA.
- Check Alibaba Cloud AHPA Paper here.
- Explore the Medium Case Study (2024) here.
- Learn more about Kubernetes Autoscaling and Best Practices for Implementations here.
4. Affinity Rules & Fault Domain Isolation: Keep Your Redundancy Real
What It Is and Why It Matters in 2025
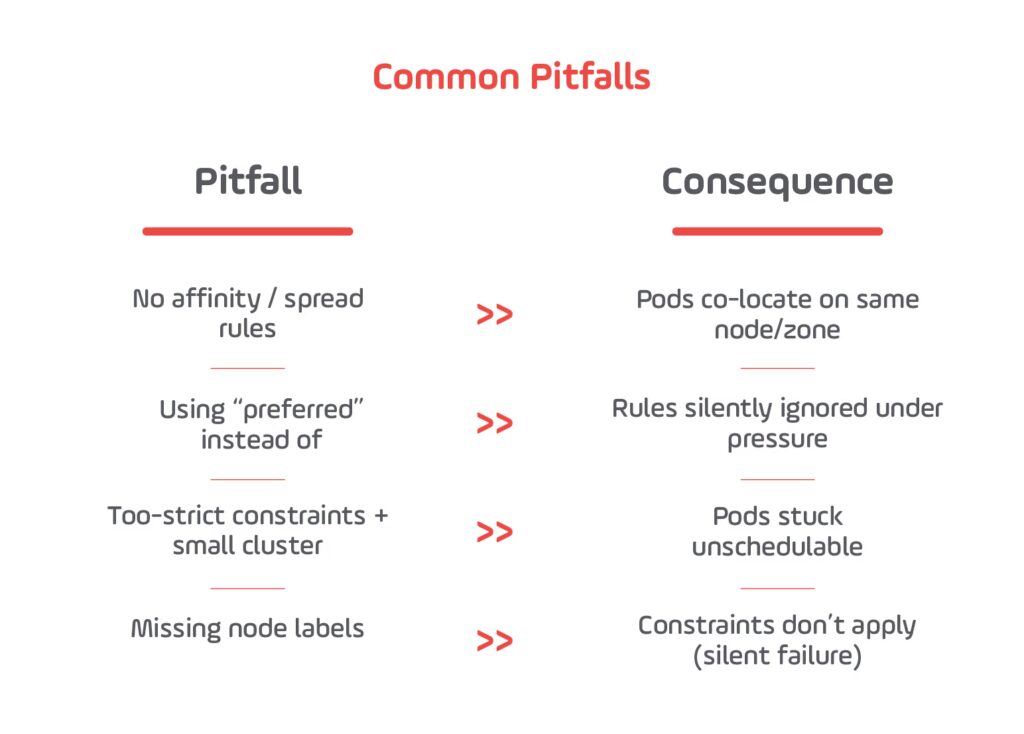
Affinity and anti-affinity rules control where Kubernetes schedules your pods, ensuring real-world redundancy by distributing replicas across different nodes or zones. By default, the scheduler attempts to balance pods, but under real pressure, replicas often co-locate, risking simultaneous failure.
In 2025, cloud-native platforms like GKE Autopilot, EKS with Karpenter, and AKS Fleet automate large clusters. Without explicit affinity rules, you risk having all replicas in the same failure domain — node or zone.
Real-World Evidence & References
- GKE Official Docs Encourage Anti-Affinity
GKE documentation warns: “Multiple Pods might run on the same node. You can optionally use Pod anti‑affinity to tell GKE to place each Pod on a separate node”. Read the full article here. - StackOverflow – Multi-Zone Scheduling Failure Case
A user experienced replicas landing all in one zone after rolling updates and cluster resize, even when using “preferred” anti-affinity. Only “requiredDuringScheduling…” prevented misplacement. Know more about multi-zone Kubernetes here. - Medium Guide: Scheduler Doesn’t Balance Zones Perfectly
A 2018 analysis noted that Kubernetes scheduler “tries but does not try hard enough,” often leaving pods unevenly distributed across zones — risking full outages in case of zone failure. Explore the full Medium Guide here.
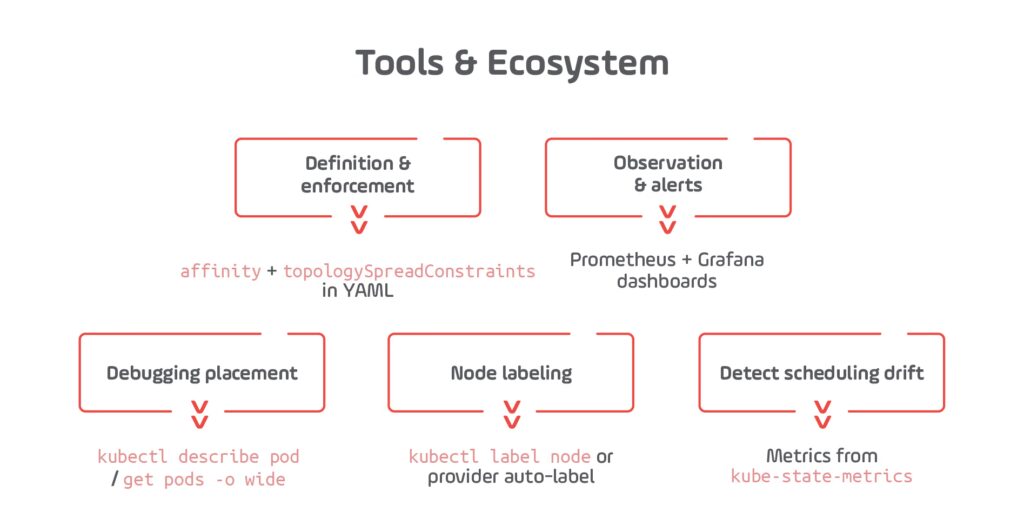
Configuration Example: Preventing Replica Co-location

- podAntiAffinity prevents multiple replicas on the same node.
- topologySpreadConstraints ensures at most one replica per zone.
Monitoring & Validation
Metrics:
- kube_pod_info{topology_zone=} — pod zone location
- pod_scheduling_failures_total — blocks due to affinity
- kube_node_labels — zone/node labels presence
External References
- Check all Kubernetes Node & Pod Affinity Docs here.
- See the GKE Zonal Topology and Anti-Affinity article here.
- Click here and read the full StackOverflow Multi‑Zone Scheduling Case.
- Explore the Medium Guide on Scheduler Imbalance here.
5. Service Mesh Resilience: Retries, Timeouts & Circuit Breakers
What It Is and Why It Matters in 2025
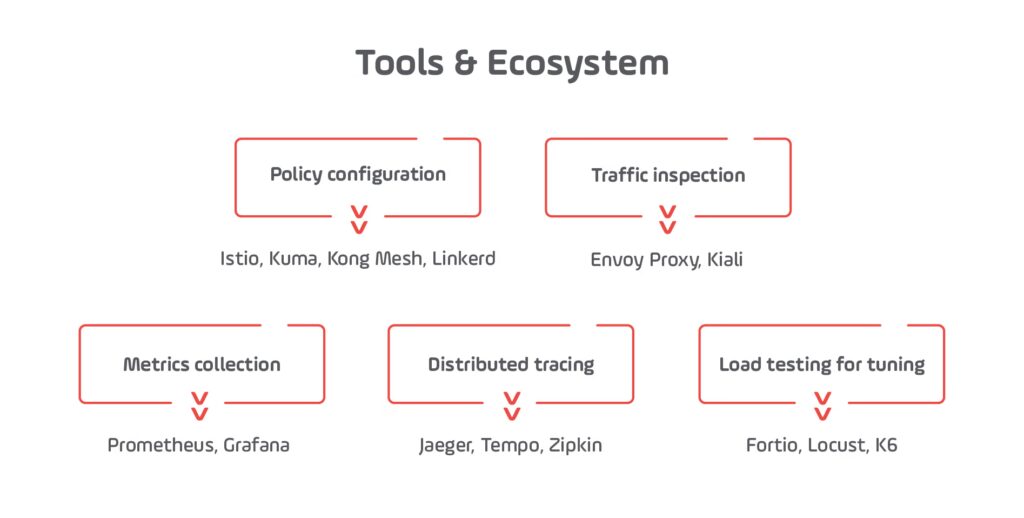
Service meshes — such as Istio, Linkerd, Kuma, and Kong Mesh — extend Kubernetes networking with fine-grained, application-aware traffic control. They enable critical resilience patterns such as:
- Retries: Automatically retry failed requests without application code changes
- Timeouts: Prevent long-hanging requests from tying up resources
- Circuit Breakers: Stop traffic to degraded or failing endpoints, protecting upstream services
In 2025, these are not optional. As enterprise backends integrate AI inference, third-party APIs, and microservices across zones and teams, partial failure is the norm. Service meshes make your systems graceful under stress — without forcing you to write extra logic into your services.
How It Works
Under the hood, service meshes use sidecar proxies (usually Envoy) to enforce policies at the application layer (L7). These proxies intercept all traffic between services and enforce the resilience policies you define via Kubernetes Custom Resources like VirtualService and DestinationRule.
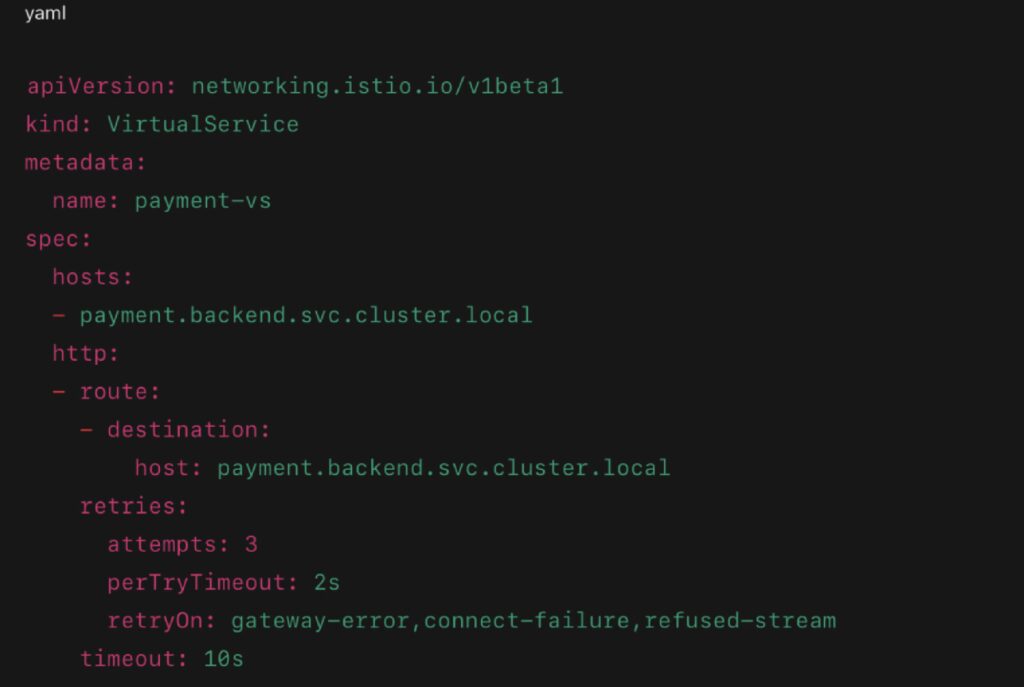
- Retries: Automatically resend failed requests with optional backoff
- Timeouts: Fail fast if a response exceeds a defined duration
- Circuit Breakers: Monitor upstream error rates and eject misbehaving endpoints (with gradual recovery)
Real-World Use Cases (Confirmed)
- AWS Blog: Enhancing Resilience with Istio on EKS (2024)
This blog outlines how Istio on Amazon EKS leverages retries, timeouts, and circuit breakers to prevent cascading failures and improve availability. - Kong Engineering Blog (2024)
Demonstrates real production configurations combining circuit breakers and timeouts to avoid overloads in Kubernetes environments using Kong Mesh (built on Envoy). - Medium Case Study (Haluan, 2023)
A detailed example configuring Istio for rate limiting and circuit breaking in an actual microservices deployment. - Netflix-Inspired Circuit Breaking Guide (2023)
Describes implementing circuit breakers using service mesh patterns modeled after Netflix’s resilience strategies. - Linkerd Docs: Retries & Timeouts in the Real World
Offers production-grade examples for how Linkerd handles retries and timeout settings to protect service health.
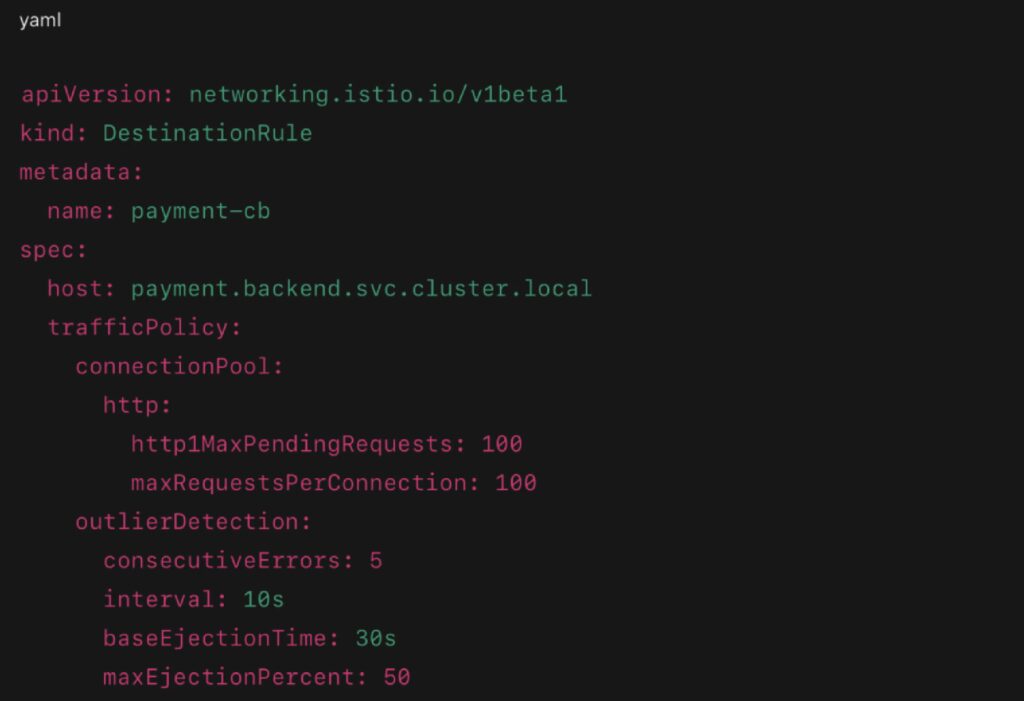
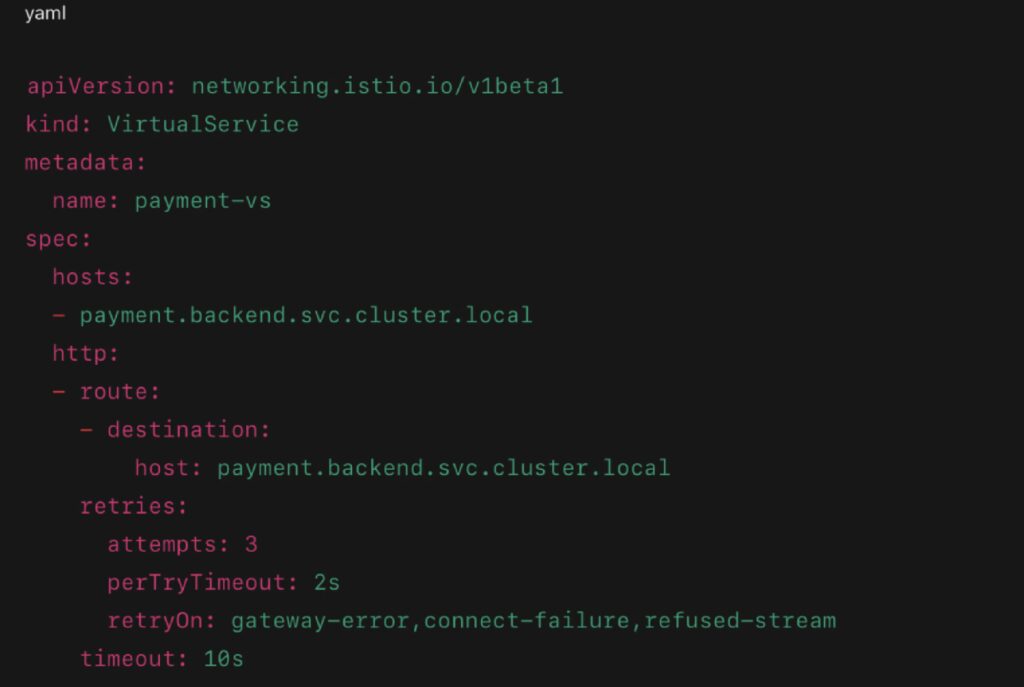
Example Configurations (Istio)
Circuit Breaker with Outlier Detection:
Retries and Timeouts with VirtualService:
Monitoring and Alerting
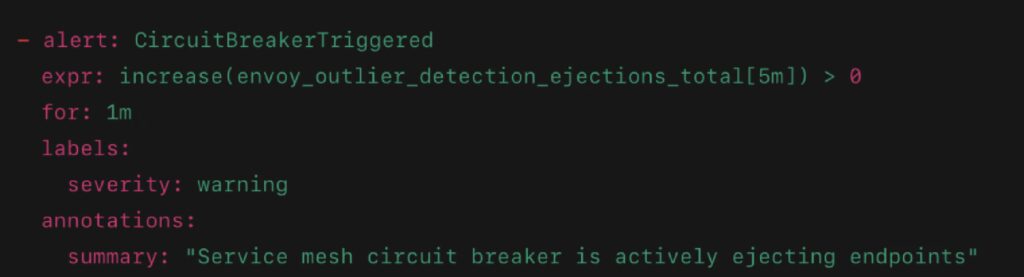
Prometheus Metrics:
- istio_requests_total{response_code!~”2..”} – track failure rates
- envoy_cluster_upstream_rq_timeout – count timeouts
- envoy_outlier_detection_ejections_total – track host ejections
Sample Alert:
Common Misconfigurations and Their Consequences
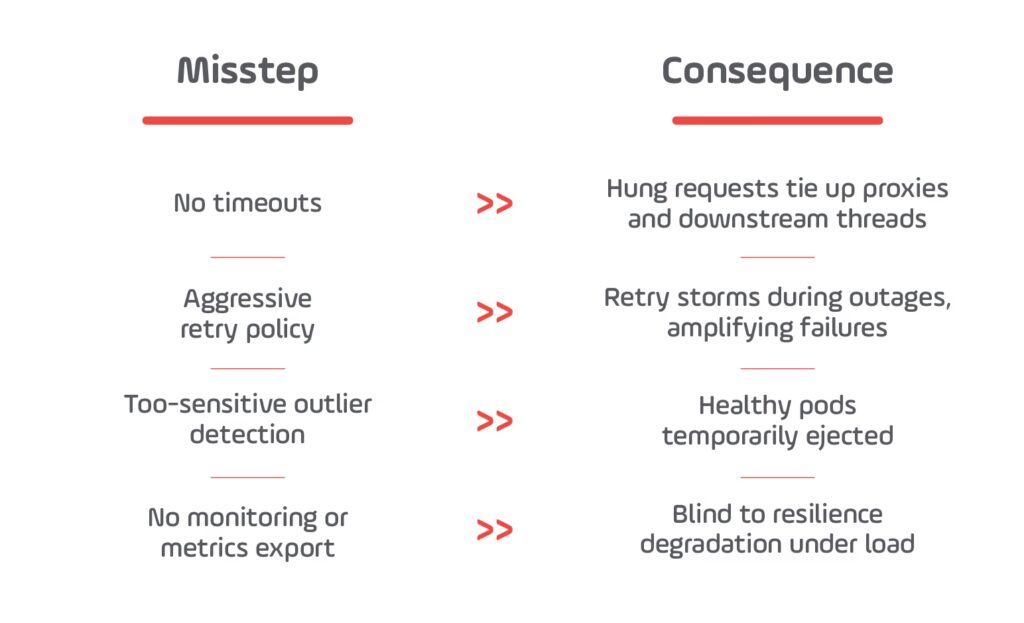
2025 Tip: Combine retries + timeouts + circuit breakers per route, and monitor changes with canary deployments before cluster-wide rollout.
External Resources
- Find out the AWS Blog on Istio here.
- Read the full Kong Engineering Guide here.
- Discover all about Istio Circuit Breaker Task here.
- See the Haluan Medium Example here.
- Explore Linkerd Timeout/Retry Docs here.
- Click here and check Netflix-Inspired Resilience Guide.
6. Persistent Volumes & Dynamic Provisioning: Making Stateful Apps Resilient
What It Is and Why It Matters in 2025
While Kubernetes is excellent at orchestrating stateless services, stateful backends (databases, queues, file-based stores) still represent a significant challenge for resilience. These components must survive pod restarts, node failures, and even full-zone outages.
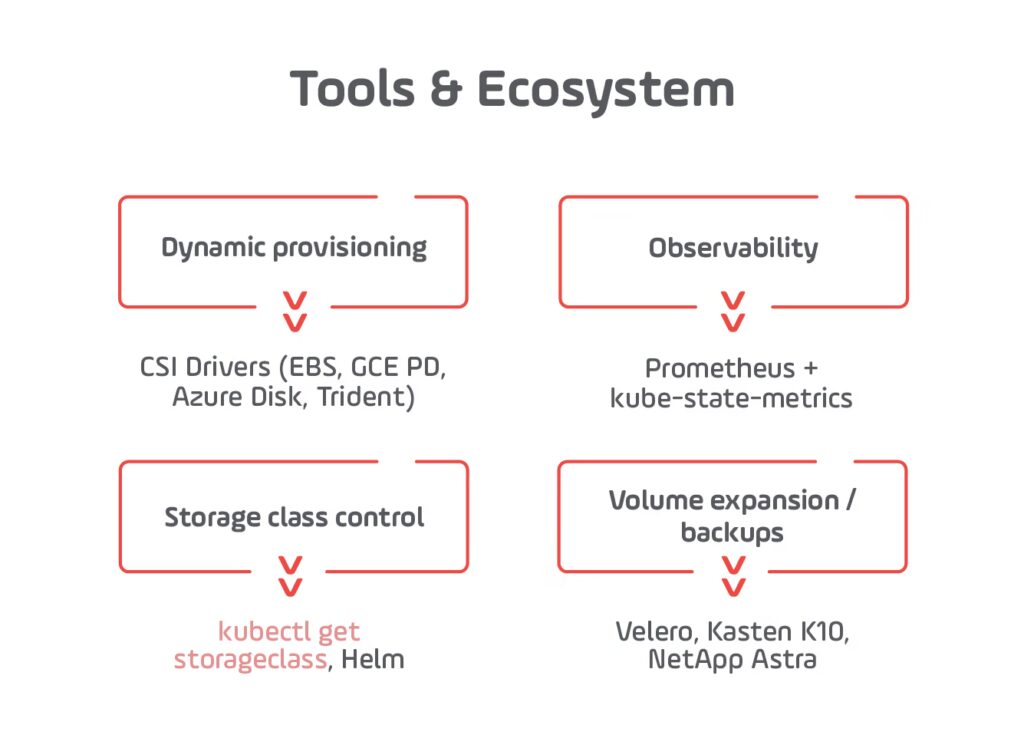
In 2025, most teams no longer hand-provision storage. Instead, they rely on dynamic Persistent Volume provisioning, integrated with StorageClasses, CSI drivers, and multi-zone backends like Amazon EBS, Google Persistent Disk, or NetApp Trident.
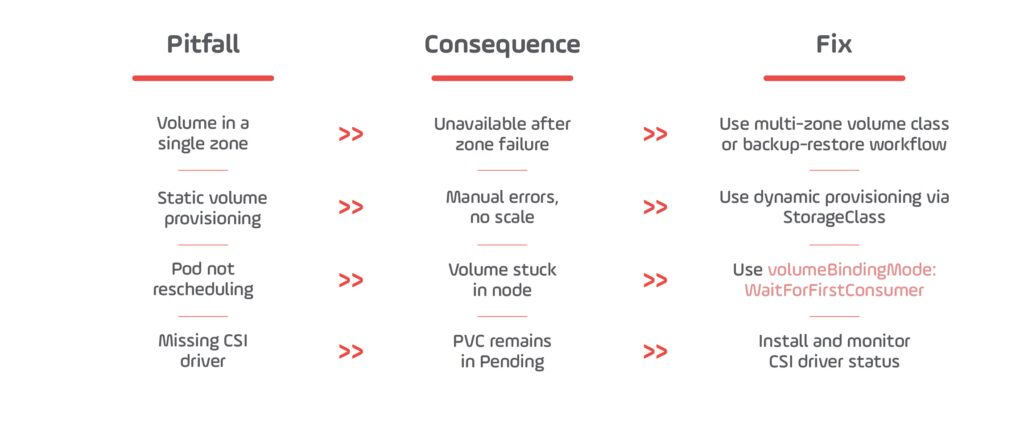
Without resilient storage:
- Data may be lost during pod rescheduling
- Volumes may become stuck if tied to a failed zone or node
- Apps may be unable to mount their data after failover
How It Works
- PersistentVolumeClaims (PVCs)
Define a storage request in your deployment (size, access mode). - StorageClasses
Define how storage is dynamically created (e.g., SSD, multi-zone, backup policy). - CSI Drivers (Container Storage Interface)
Abstraction layer allowing Kubernetes to interact with various storage backends. - Dynamic Provisioning
PVCs are automatically fulfilled by the storage system without manual volume creation.
Real-World Examples
1. Google Cloud Filestore + StatefulSet CrashLoop
In a 2023 postmortem published on Reddit and discussed on Hacker News, a gaming backend using GKE and Filestore experienced pod CrashLoopBackOff because the volume was tied to a single zone. After a zone outage, the app couldn’t recover until the team migrated to a multi-zone Filestore configuration with dynamic provisioning.
2. AWS EKS + EBS CSI Driver with Dynamic Volumes
Amazon documents how the EBS CSI driver dynamically provisions volumes on-demand, including a resilient “gp3” class that supports failover and snapshots.
3. NetApp Trident + PostgreSQL StatefulSet
NetApp shared how customers deploy HA Postgres clusters using dynamic volume provisioning via Trident, supporting automatic volume expansion, backups, and zone-aware failover.
Example YAML for Dynamic Volume Provisioning
- storageClassName: dynamically creates volume via StorageClass
- ReadWriteOnce: pod mounts volume exclusively
- Backed by a CSI driver like AWS EBS, GCP PD, or Azure Disk
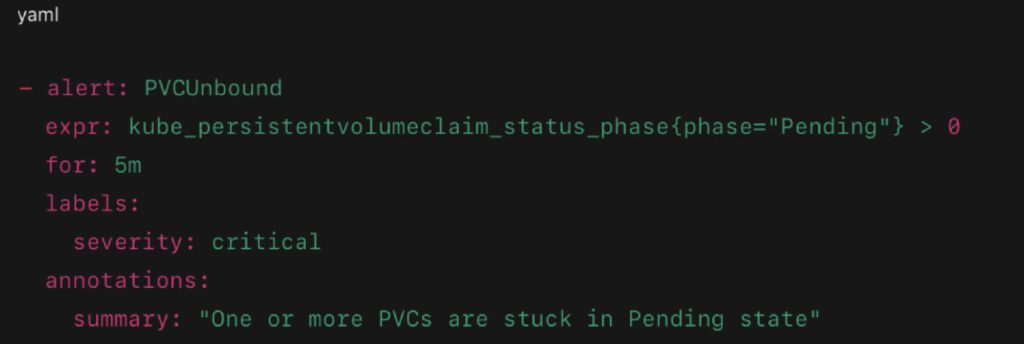
Monitoring & Alerting
Key Metrics:
- kube_persistentvolumeclaim_status_phase
- kubelet_volume_stats_available_bytes
- storage_volume_attachment_failures_total
- container_fs_usage_bytes (filesystem-level usage)
Sample Alert (Prometheus):
Common Pitfalls & Fixes
External Resources
- Explore AWS EBS CSI Driver here.
- Check the Google GKE Dynamic Storage here.
- Know more about NetApp Trident for Kubernetes here.
- Discover more about the CNCF Storage Whitepaper here.
- Learn more about Velero for Volume Backup/Recovery here.
7. Multi-Zone Clusters: Surviving Regional Failures with Kubernetes
What It Is and Why It Matters in 2025
Even in 2025, zone-level outages remain one of the top sources of unexpected downtime in cloud platforms (e.g., network blackholes, control plane failure, infrastructure maintenance). Running Kubernetes in a multi-zone clusterensures that your backend services stay available even if an entire availability zone (AZ) fails.
Cloud providers like AWS, GCP, and Azure all support multi-zone Kubernetes clusters. But high availability doesn’t happen automatically — you must configure:
- Node pools in different zones
- Pod spreading policies
- Replication and storage across zones
- Network-aware load balancing
Without these, a zone outage could still wipe out all replicas of your service, even in a multi-zone cluster.
How It Works
Multi-Zone Kubernetes Cluster Basics:
- Kubernetes nodes are distributed across multiple availability zones
- Control plane typically runs in a separate managed zone or region (e.g., GKE Regional, EKS Control Plane HA)
- Workloads are scheduled using:
- Pod topology spread constraints
- Anti-affinity rules
- Zonal labels on nodes
- Cloud load balancers automatically route traffic across zones
Real-World Use Cases
1. GKE Regional Clusters (Official Case Study)
Google Cloud documents how regional clusters (3 AZs) improved uptime by 99.99% for companies like Shopify, even during a full-zone failure.
2. Airbnb’s Kubernetes Outage Retrospective (2021)
Airbnb’s SRE team shared how an availability zone outage affected a high-traffic service that lacked zone-aware pod scheduling. Postmortem recommended mandatory topology constraints.
3. Microsoft Azure Guidance for AKS HA
Microsoft recommends multi-zone AKS clusters with node pool separation and pod anti-affinity for production HA workloads.
Example Config: Spreading Across Zones
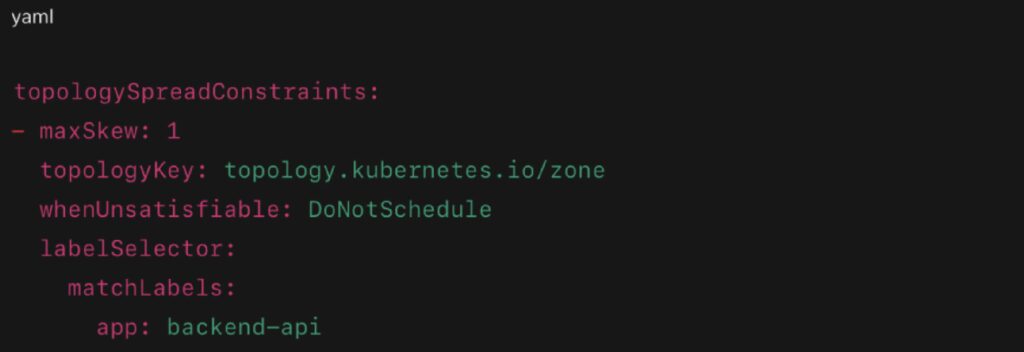
- Ensures pods are evenly distributed across zones
- If a zone fails, other zones still run healthy replicas
Monitoring & Alerting
Key Metrics:
- kube_node_labels{topology_zone=…} – verify node spread
- kube_pod_info{topology_zone=…} – pod spread
- pod_disruption_events_total – if a zone outage occurs
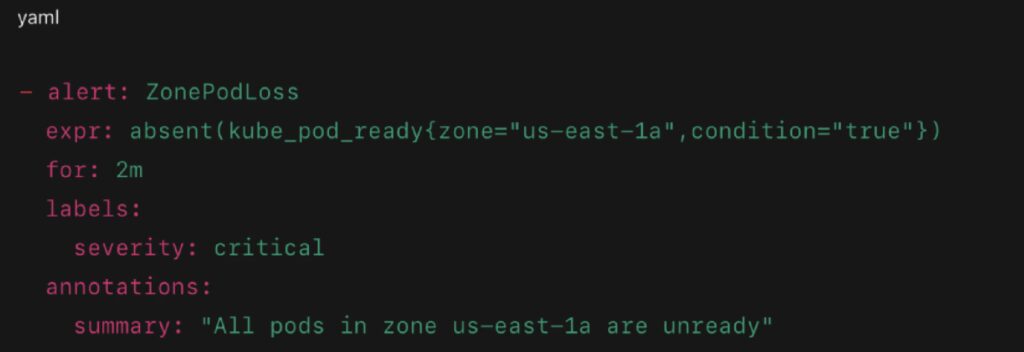
- kube_pod_ready{zone=”us-east-1a”} – zone-specific readiness
Prometheus Alert Example:
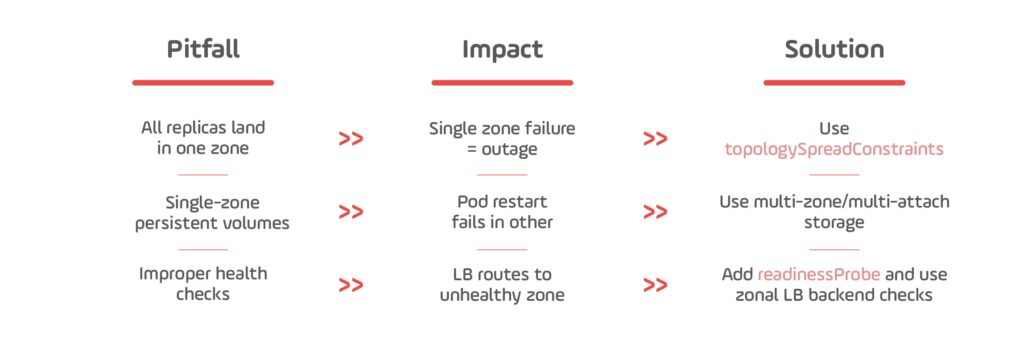
Common Pitfalls and Solutions
External Resources
- See all GKE Regional Clusters here.
- Learn more about Azure AKS HA Zones here.
- Find out the AWS Advanced Multi-AZ Resilience Patterns here.
- Discover Chaos Engineering for Zone Failure Testing here.
Build Backends That Bounce Back
In 2025, backend resilience isn’t a side concern — it’s the defining quality of scalable, trustworthy systems. Kubernetes equips engineering teams with the primitives to build fault-tolerant services, but true resilience comes from how you layer, connect, and operationalize those tools.
Throughout this guide, we’ve explored how Pod Disruption Budgets, readiness probes, autoscaling policies, affinity rules, dynamic volume provisioning, and multi-zone awareness work together to protect your workloads from the full spectrum of modern failure scenarios — from rolling deployments to full AZ outages.
But tooling alone won’t deliver reliability. The real differentiator is intentional design backed by cultural readiness — clear ownership of failure domains, effective observability, and proactive failure testing.
If your team is maturing its Kubernetes or cloud-native practice, now’s the time to evaluate your platform’s fault tolerance end-to-end. That includes understanding how infrastructure, CI/CD, and application code all interact under pressure. For a broader perspective on how Kubernetes fits into modern software delivery and DevOps strategy, explore Growin’s Complete Guide to DevOps in 2025.
Ultimately, resilient systems aren’t just about uptime — they’re about engineering confidence. Confidence that a pod can restart, a node can vanish, a region can go offline — and your users will never notice. That’s the kind of backend worth investing in.